Summary
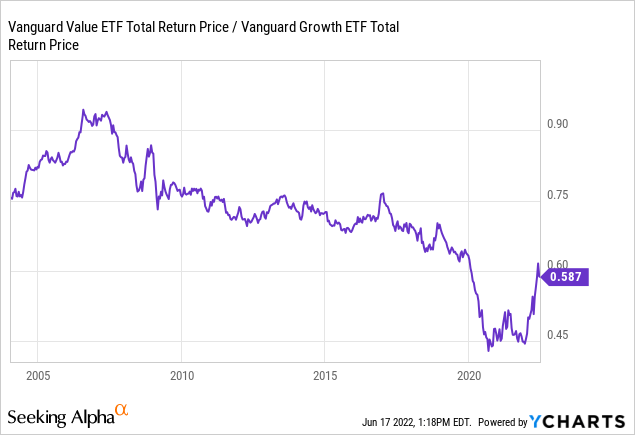
- Value stocks have underperformed growth stocks since 2006.
- There are four possible explanations for this: 1) more efficient markets, 2) randomness, 3) the growing importance of intangibles and 4) low interest rates. All explanations have some merit.
- Value stocks should be a good bet for this decade because they are currently very cheap.
This article was originally published on Seeking Alpha.
Value investing has a long and illustrious history. Since 1825, value stocks have beaten growth stocks by 3.7% a year.
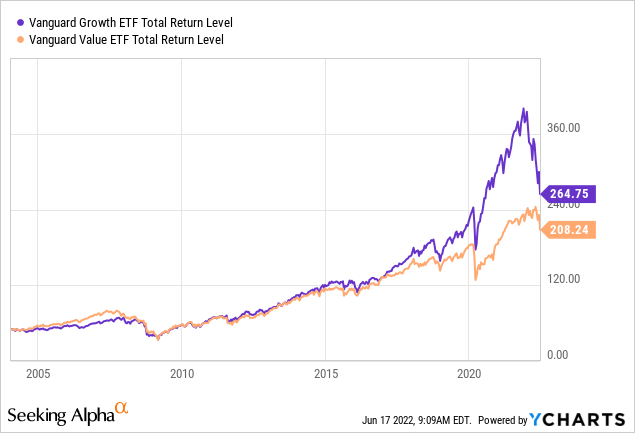
More recently, though, value investing has been a losing proposition. Over the past 18 years, growth stocks (VUG) beat value stocks (NYSEARCA:VTV) by 1.3% a year.
Even famous value investors have had a tough time. Warren Buffett, for example, underperformed the S&P 500 index for the 5, 10 and 15 years ending 2020.
When a previously successful strategy stops working, investors look for explanations. Has something permanently changed, or is value investing just going through a rough patch that will eventually end?
In this article, we will consider four possible explanations for value investing’s poor recent performance.
Explanation 1. Markets have become more efficient
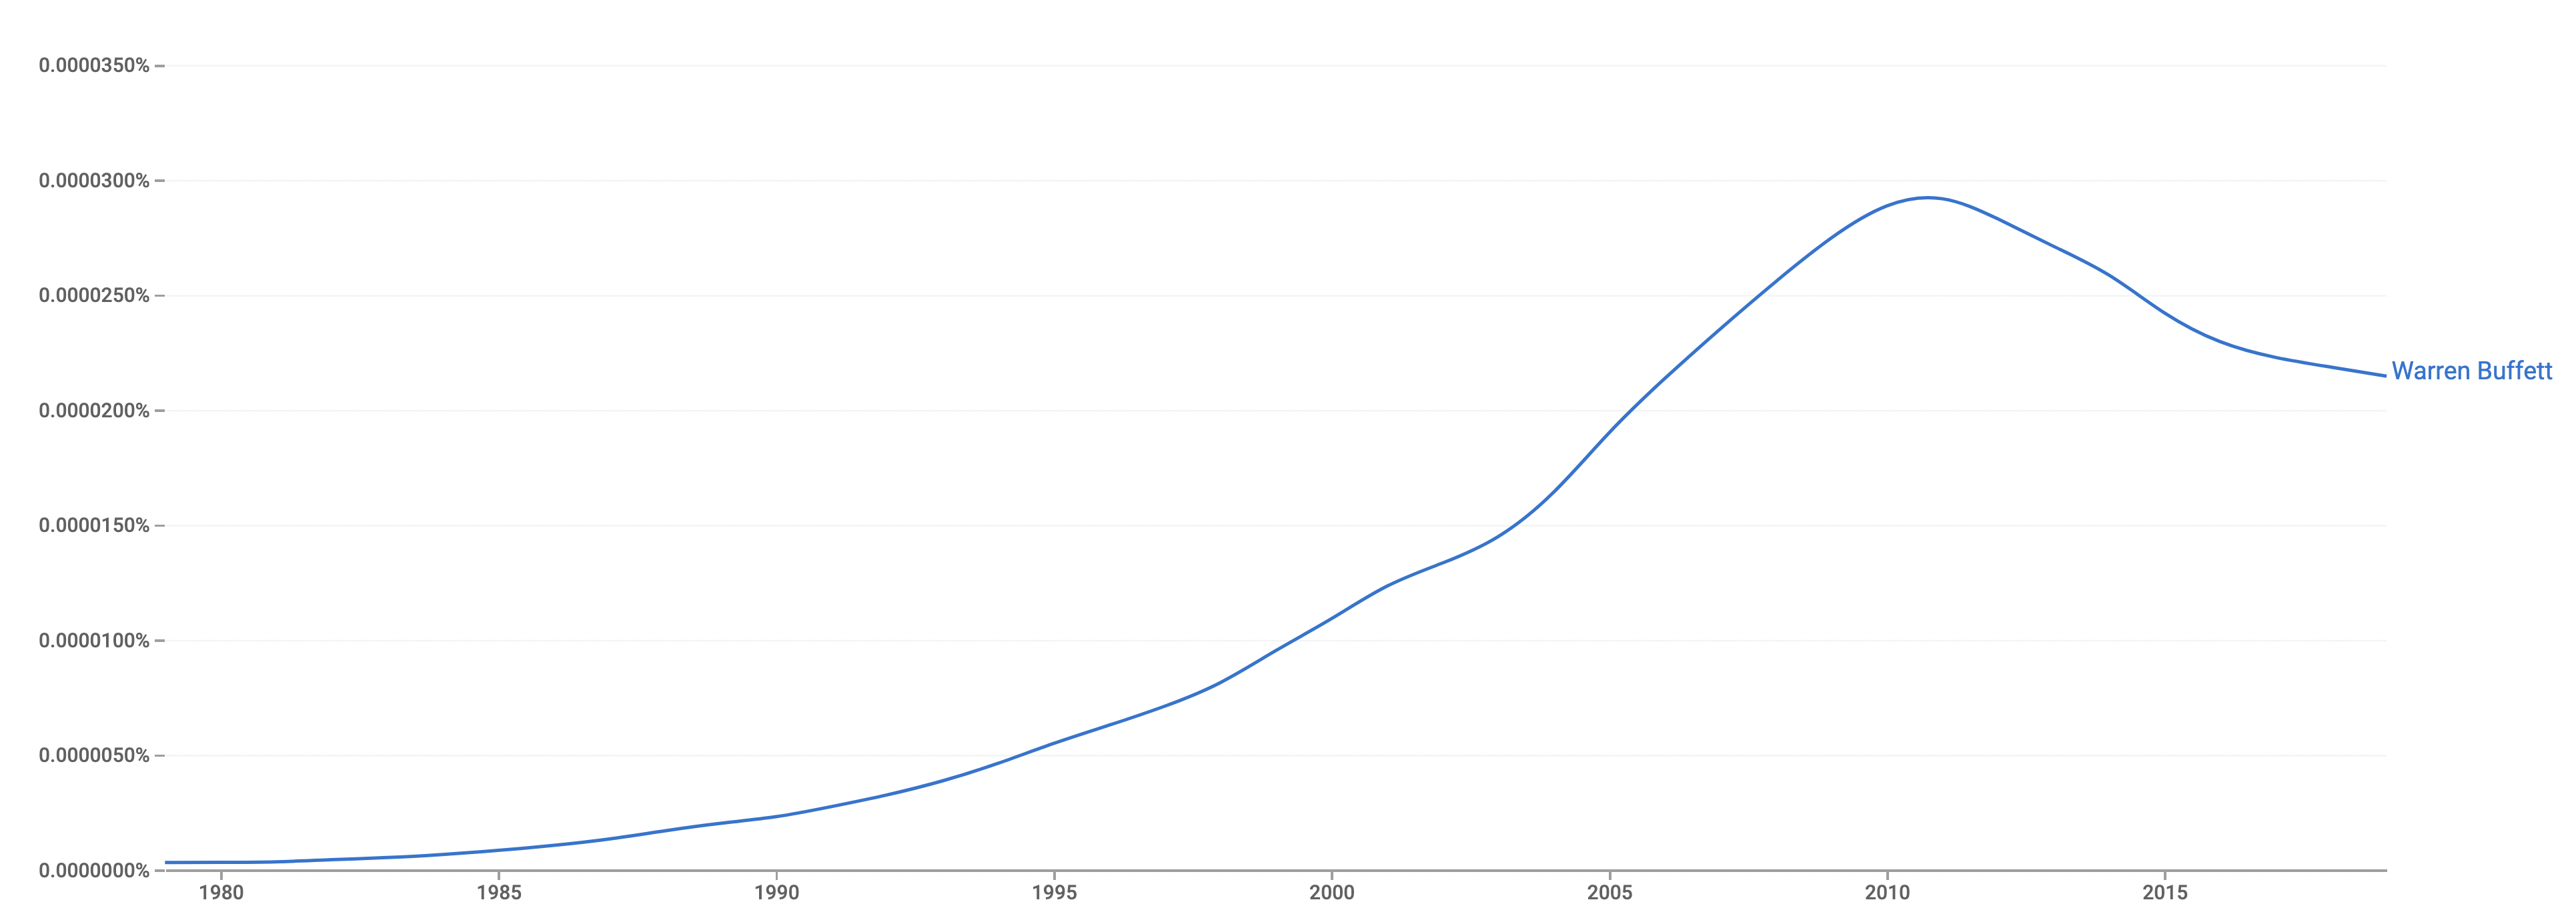
In 1979, approximately 20 people attended Warren Buffett’s investment vehicle Berkshire Hathaway’s annual meeting.
By 2015, that number had ballooned to more than 40,000, and millions of viewers watched the event on a Yahoo livestream.
This means that in 40 years, Buffett and his investment philosophy went from obscure to mainstream.
Value investing is now commonly taught at universities. One of the most popular coursebooks, Value Investing: From Graham to Buffett and Beyond, is in its second edition, having sold more than 100,000 copies worldwide.
There are hundreds of value investing funds, and Value ETFs such as VTV have attracted hundreds of billions of dollars in assets.
Value investing is now a popular strategy, with a large following.
Value investing is supposed to work because people make mistakes. Naive investors sell stocks hit by bad news, and buy stocks of well-performing “glamour” companies, regardless of price or fundamentals.
But what if people learn from their mistakes? If an investor studies the history of the market, and perhaps reads Warren Buffett’s annual reports, they are less likely to buy glamour stocks, and may even position to take advantage of others buying them.
As knowledge about the Value strategy spreads, there are fewer and fewer investors who continue to blindly buy glamour stocks regardless of fundamentals. The profit from the Value strategy then slowly disappears as the pool of naive investors shrinks.
This is not a theoretical argument: there is evidence to show that the market learns from its past mistakes. A study published in 2016 found that after a strategy is published, its profits diminish.
Most strategies do not immediately stop working after publication. Traders working for hedge funds and other arbitrageurs need to learn about the strategy and allocate capital to it. It has historically taken 15-20 years for all profits from a published strategy to be eliminated.
The Value strategy became well-known in the 1990s, so those 20 years have passed. By now the strategy is well-known, and it could thus plausibly be argued that it has been arbitraged away.
If this explanation is true, value investing is permanently damaged.
Explanation 2. Randomness/bad luck
It is usually after a long period of underperformance that investors start asking tough questions about a strategy.
Might it be, though, that the poor recent performance of the Value strategy was simply due to bad luck? All strategies go through drawdowns from time to time, and historically, the Value strategy has been no different.
Over the past 200 years, there were five Value crashes: 1841 (a -50% drawdown), 1862 (-49%), 1904 (-59%), 1932 (-54%) and 2020 (-59%).
Studying these past crashes shows that there is precedent for the Value strategy going through long dry spells. The crash that ended in 1904 started around 1890, lasting for an agonising decade and a half.
The current difficulties of the Value strategy started in 2006, 16 years ago.
As long as 16 years may seem, it is too short a period to make definitive statistical conclusions about the long-term performance of the Value strategy. We can imagine how those value investors who gave up in 1904, after 15 years of poor performance, felt about their decision over the following decades.
Proponents of value investing can thus use historical experience to argue that although the environment for value investing has been challenging for the past decade, this is a temporary issue and the environment will sooner or later turn more hospitable.
Indeed, it can be proposed that Value, like other investment strategies, goes through bull and bear phases in a never-ending “Quant Cycle“.
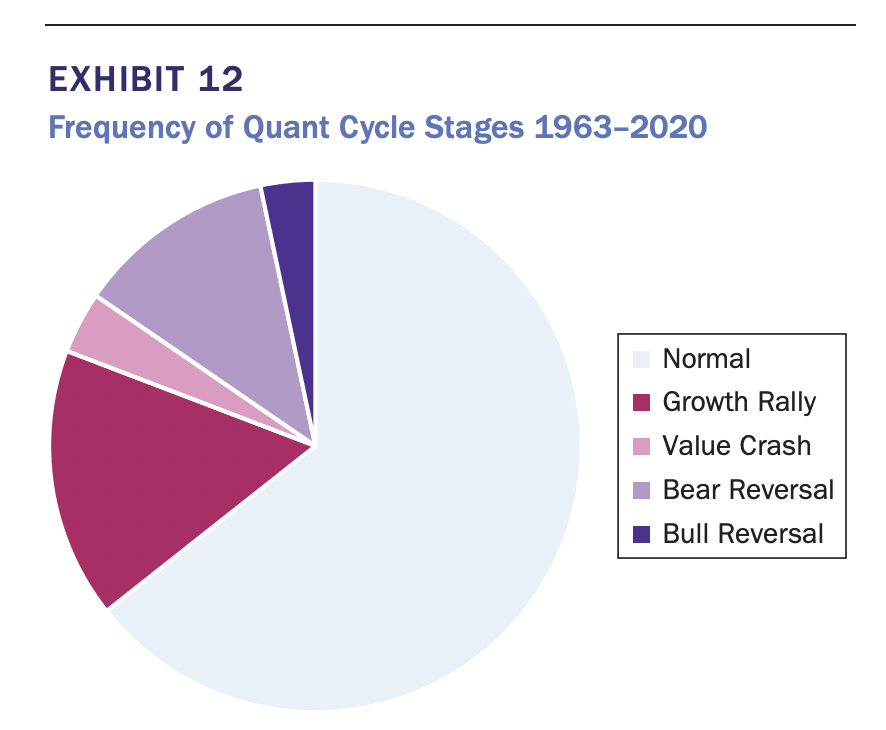
These bull and bear phases appear to be driven, at least in part, by changes in a strategy’s popularity. This popularity, in turn, is to an extent determined by the strategy’s recent performance, because many investors look at past 1-3 year returns when allocating capital. Sometimes, a strategy performs well and attracts followers, sometimes it performs poorly and loses followers.
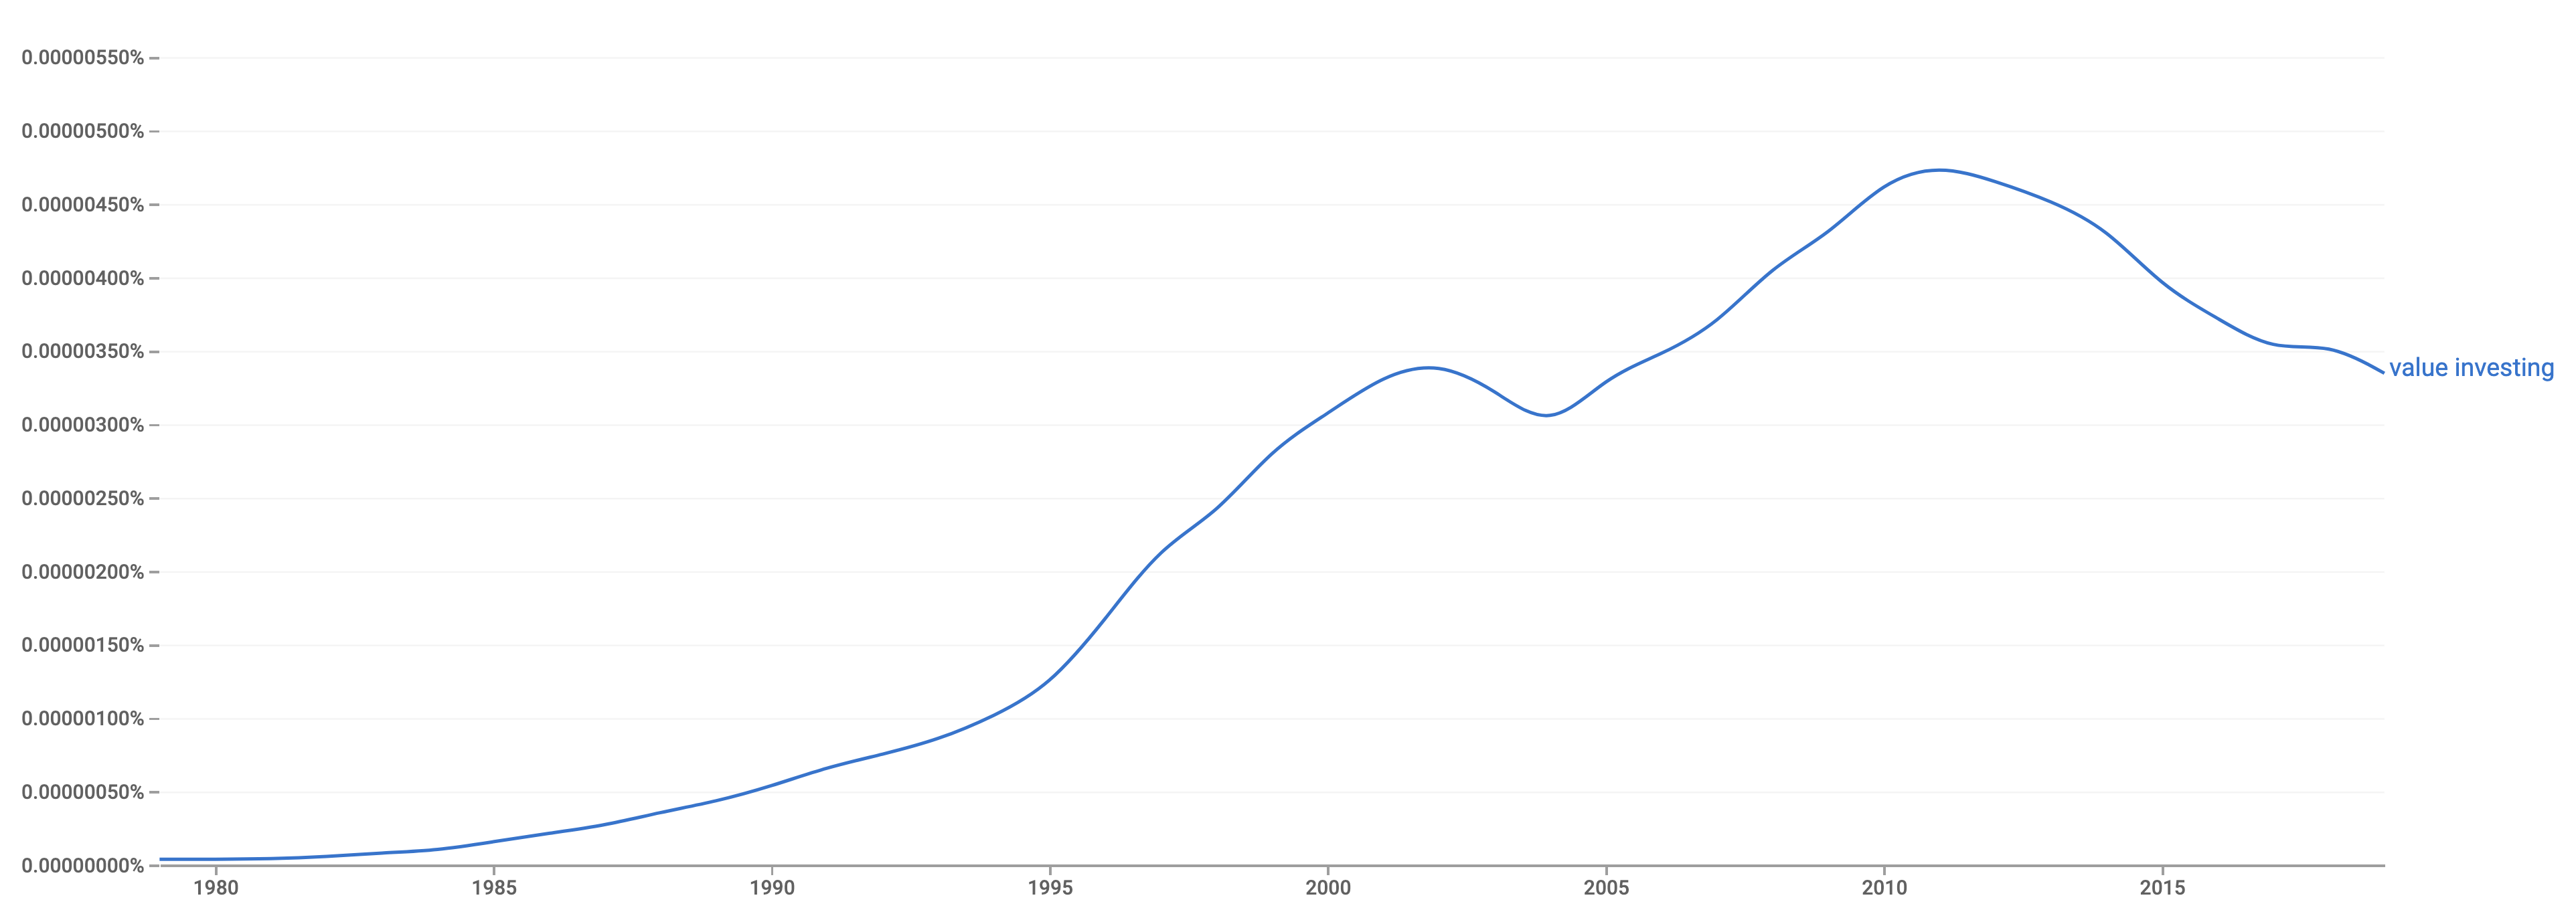
After rising in popularity in the 1990s and 00s, value investing appears to have lost popularity since 2010. (See the Google Books Ngram charts in the previous section.) Perhaps, then, what happened over the past decade is that the Value strategy lost followers, leading to poor performance, leading to more losses of followers, leading to worse performance, and so on.
Eventually, the result of this process is that value stocks become too cheap, the strategy starts performing again, attracting followers, then more followers, until value stocks become too expensive, which is when the process goes once again into reverse.
If this explanation is true, value investing is simply going through one of its bad patches, which it tends to experience every 40 years or so, and it will recover.
Explanation 3. Growing importance of intangibles
Value investors have traditionally used book value as an important value metric, and many (especially academic) value strategies are based on sorting stocks by price-to-book ratios.
Book value, though, is becoming less useful to investors due to the increasing importance of intangible assets such as patents, trademarks and customer relationships, which are not properly captured on company balance sheets.
The fact that a technology company such as MSFT trades at 12x book value does not automatically mean its shares are overvalued. It may simply mean that the assets the company has are not included on its balance sheet.

The growing importance of intangibles is an area that has attracted increasing research attention in recent years. Researchers have found that by adjusting book value for intangibles, value strategies can be improved.
These adjusted strategies still lose money in the post-2006 period, however, so intangibles cannot be the only explanation for Value’s recent drawdown.
Explanation 4. Low interest rates
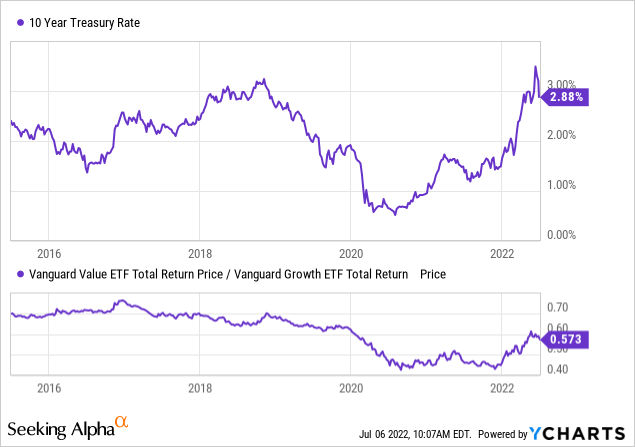
It is well-known that value stocks tend to do well when interest rates rise, and badly when they fall.
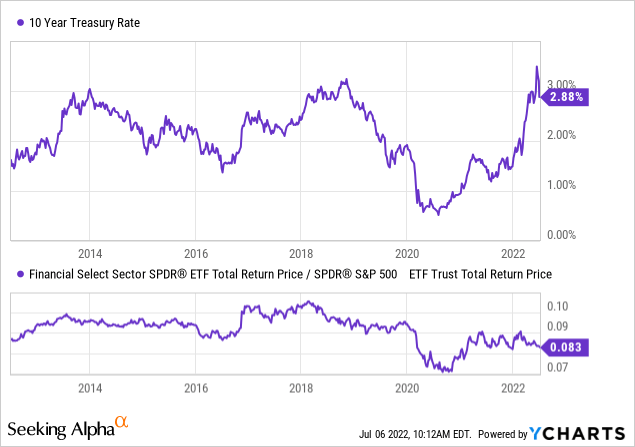
One reason for this is that value stock indices are overweight the Financial sector (XLF), which tends to benefit from rising rates.
Interest rates fell from 2006 to 2021, which may have contributed to Value’s post-2006 drawdown.
Interestingly, though, the strong correlation between value stocks and interest rates is only a recent phenomenon.
Since the 1960s, the average correlation between value stocks and interest rates has been weak or non-existent.
It may be that the recent high correlation is a result of the zero lower bound (ZLB) which is where interest rates have found themselves at for much of the past decade. Research has found that banks suffer from low interest rates, and thus it makes sense that Value indices, which are overweight the Financials sector and banks, would benefit from higher interest rates, as long as rates are at, or close to, the zero lower bound.
Concluding thoughts
I believe all the previous four explanations have some truth to them.
It is true that the stock market is more competitive and efficient than it was in the 1990s. This can be seen in the dwindling alpha of hedge funds. It was easy to outperform the markets in the 1990s, and it is very hard today.
Value strategies are easy to implement and widely available, so I do not believe a simple value strategy such as buying VTV and holding forever will lead to outperformance, at least on a risk-adjusted basis. There might be some outperformance on a raw, unadjusted basis, but it can be explained away as being due to the greater cyclical exposure taken on by value investors. (VTV is overweight the cyclical sectors Financials and Energy, and holding such risky companies deserves earning a risk premium.)
The previous negative expectation has to be qualified. I believe value stocks are currently so cheap that holding them for the next 5-10 years should produce outperformance also on a risk-adjusted basis.
This opportunity exists because the good performance of growth stocks over the past decade led to fundamentally unjustified flows into that part of the market, especially during the COVID-19 pandemic.
In terms of what a value strategy for the 2020s and beyond should look like, I believe intangibles should not be ignored. A modern approach to value has to incorporate an assessment of a company’s brand, customer base, and human resources.
Finally, there are interest rates. The short-run correlation between interest rates and value made sense in the 2010s’ low-growth, low-inflation economy. Interest rates may now be leaving the zero lower bound, and once they do so sustainably, the correlation between value/growth and interest rates should diminish.
In conclusion, I believe value stocks are a good bet for this decade, but it is complacent to believe that beating the market with any style of investing will be easy or even possible in the long run.