Summary
- The U.S. stock market looks expensive, judging by the Shiller CAPE ratio.
- But CAPE should not be used to time the market.
- Persistently low (real) interest rates imply that the market can stay expensive for a long time.
- For those willing to deviate from the index, value stocks offer higher expected returns than the market in general.
“Today in the U.S. we are in the fourth superbubble of the last hundred years,” Jeremy Grantham, co-founder of asset management group GMO, asserted in an article “Let the Wild Rumpus Begin” published a few weeks ago. The article received considerable media coverage in part because it was published when there were fears the stock market was entering its first correction in two years. Stocks had steadily risen in 2019, 2020 and 2021, fuelled by fiscal and monetary stimulus, and the bubble argument was thus intuitively plausible.
In his article, Grantham argues that stocks, real estate and commodities are all badly overvalued. “This time last year it looked like we might have a standard bubble […]. But during the year, the bubble advanced to the category of superbubble, one of only three in modern times.”
Grantham relates the U.S. stock market today to those in 1929 and 2000. Both were bubble years which were followed by famous market crashes. In the housing market, Grantham equates the current situation with Japan in 1989 and the U.S. in 2006. Both housing bubbles ended badly.
Markets are expensive relative to history
Grantham’s bubble argument is based on the fact that stock and housing market valuation levels are significantly above their long-term trends.
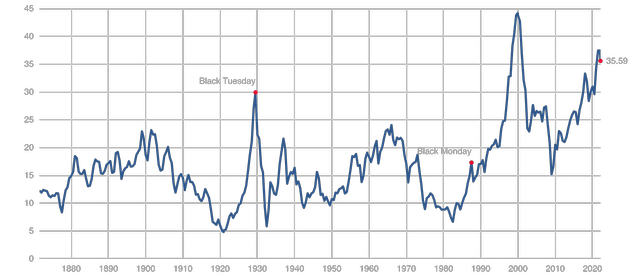
The valuation level of the stock market can be assessed with the cyclically-adjusted price-earnings ratio (CAPE) developed by Yale professor Robert Shiller. The higher the CAPE, the more expensive the market.
The long-term average CAPE is 17, but at present, CAPE is much higher, 36. This could be interpreted as meaning that the market would have to crash by 50% in order for the overvaluation to be eliminated.
Markets are difficult to time
While many, like Grantham, believe that sooner or later market valuations will revert to mean, there is no natural law that says this must happen.
A few years ago, Dennis Tilley of Merriman Asset Management published an article about the problems that can result from using CAPE to time the market.
The first problem is that CAPE is popular because it has worked historically. But that might just be luck. Tilley gives examples of other indicators that were once widely used but lost their popularity over time as they ceased to function.
The second of Tilley’s arguments against CAPE is that investors were historically unable to improve risk-adjusted returns by using it. When the stock market CAPE was low, risks were high, and non-equity investments were also cheap. As an example of this, Tilley cites the early 1980s, when the stock market CAPE was low, but there were also good returns available in the fixed income markets.
Tilley’s third and perhaps most important argument is that there is no inherent reason why CAPE should revert to its mean over a period of time that is of interest to investors. It can take, for example, 25 or 50 years for mean reversion to happen. An investor who stays out of the stock market for that long will almost certainly lose out to a buy-and-hold investor.
Low interest rates = expensive stocks
Tilley’s last argument explains why CAPE has long been above average.
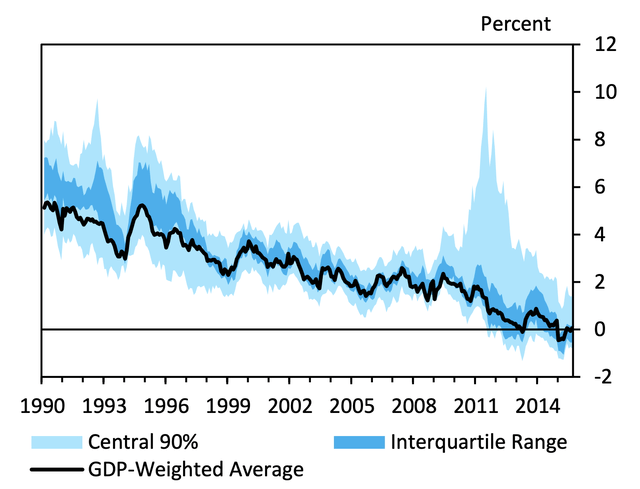
Interest rates have fallen steadily in recent decades. There is a number of reasons for this, including a slowdown in economic growth, demographic change, China’s integration into the world economy and growing inequality. The direction of these trends is unlikely change in the near future, even if it has been argued that demographic change may eventually start to pull interest rates higher.
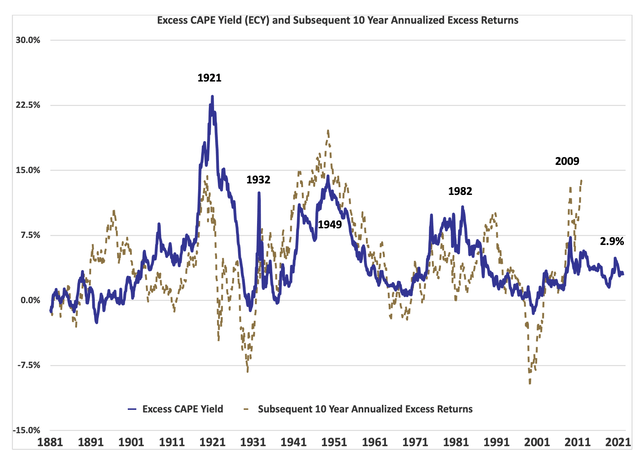
If interest rates are low, stocks can and should be expensive, because they are priced in relation to what is available in other markets. Shiller himself has recognized this and now publishes a measure called the Excess CAPE Yield.
When assessing market valuations, it is also important to note that in recent decades, the rise of index funds and reductions in brokerage commissions have made investing in stocks cheaper, and awareness of the good historical returns of the stock market has spread.
All of these factors contribute to the outcome that the “fair” CAPE of the U.S. stock market is currently significantly higher than the historical average 17.
CAPE, Tilley concludes, is a better tool for estimating return expectations than for market timing. Currently, the U.S. CAPE 36 implies that return expectations are low compared to history. That does not mean that shares should be sold, however, as they may remain more expensive than average for a long time, and they are still priced to produce positive excess returns, judging by the Excess CAPE Yield.
Value stocks attractively priced
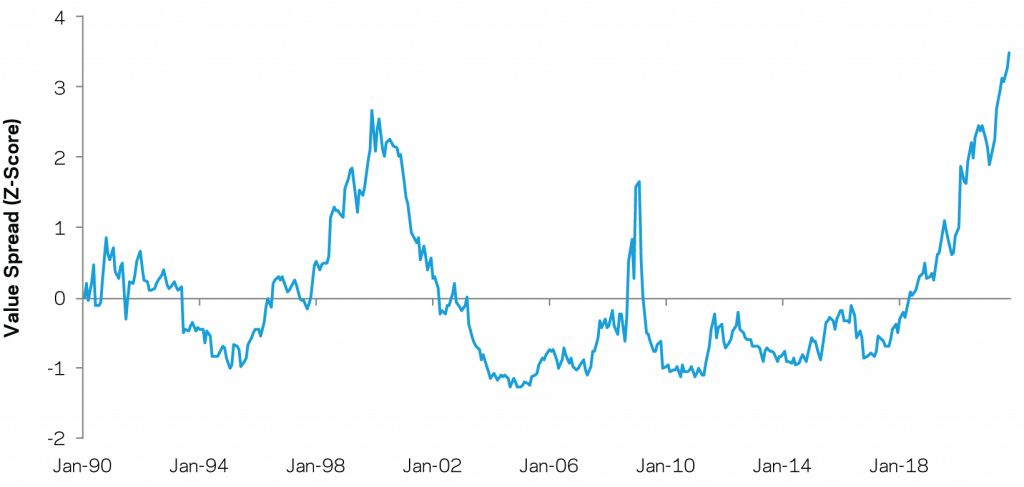
For those investors who want to pursue higher returns than the U.S. market seems to offer, based on its CAPE, there are sectors in the market whose valuations have not risen in the same way as in the U.S. Value stocks have done badly for a long time, so their valuation levels relative to growth stocks have become exceptionally attractive in recent years.
The gap between growth and value stock valuations is currently the widest ever, even wider than at the peak of the technology bubble in early 2000, asset manager AQR asserted in December 2021. This is interesting because after the bursting of the 2000 bubble, value stocks beat growth stocks every year until 2007.
More generally, when the history of the market has been studied, it has been found that the cheaper value stocks are relative to growth stocks, the better their future returns have been. In the current situation where the spread in valuations is significant, value investment firm Research Affiliates predicts that value stocks will beat their benchmarks by about 5 percent a year. Similar predictions can be read from other sources.
Now may be the best opportunity in two decades to invest in value stocks, argued asset manager GMO’s Ben Inker last year. I believe this is true. The stock market is generally expensive, but this does not mean that investors should stop investing in equities. The market is not in the bubble described by Grantham, and value stocks are still reasonably priced. The growth-value spread suggests that by investing in value stocks, investors will be able to achieve significant excess returns in the 2020s.